Matryoshka Representation Learning (MRL) from the Ground Up
What do these scary sounding words mean?
This article is best suited for ML practitioners and researchers, but is written in an attempt to be accessible to anyone interested in machine learning, artificial intelligence, and tech. Reading Time Estimates for the entire article:
- ML Practitioner: 25 minutes
- Working in Computer Science/Tech: 40 minutes
- Generally Interested: 1 hour+
Edits
- Feb. 14, 2024: added new detailed Sections for Why Does MRL Work and Adaptive Retrieval. Also added additional details behind creating MRL with nested low dimensional codebooks and links to excellent blogs and products using MRL!
- Apr. 29, 2024: I gave a talk at UW Madison’s MLOPT idea seminar about MRL, which is up on Youtube!
What is MRL?
If you keep yourself updated on OpenAI’s blog posts, you may have seen the recent release of new embedding models, which included support for shortening embeddings, where developers could simply “remove some numbers from the end of a sequence” and still maintain a valid representation for text. Why is this cool?
- Save a lot of memory (storing the embedding)
- Improved Search latency (smaller embeddings = faster search)
- Critical: What if the biggest embedding isn’t the best? And what does the best even mean?
Update: thanks @owencm and @OpenAI for clarifying that shortening embeddings are based on MRL and thanks for sending the blog for edit. Many thanks to @owencm for being super generous in their response ♥️ We all win by pushing open research and appropriate attribution! https://t.co/GbJBgzWwO5
— Prateek Jain (@jainprateek_) January 28, 2024
This property emerged in the new models due to a mysterious and unspecified “technique”. After some very minor subtweeting, OpenAI kindly updated their blog post (see above) to remove this shroud of mystery to reveal this technique: ![]() Matryoshka Representation Learning
Matryoshka Representation Learning![]() , which you should fully understand from this single GIF:
, which you should fully understand from this single GIF:

What?
You didn’t understand a lot of what you just read? That’s okay, let’s take a step back.
Note: For ML Researchers or those familiar with this space, feel free to skip directly to the Matryoshka
section.
Representation Learning
tl;dr
Modern Deep Learning allows us to learn good representations for data, instead of having experts handcraft them. The Matryoshka Section will take closer look at what “good” means.
How do we Represent Data for Computers?
Let’s say you want to build something cool using some data that you have - a fairly general problem we all face every day. With computers, we need a way to represent this data - an image, text, data table, audio - in a way computers can understand. Computers understand data with numbers, and we typically arrive at these numbers with some function \(\textcolor{gray}{f}\) that maps the data from its original representation (e.g. an RGB encoding of an image) to a sequence of \(\textcolor{gray}{d}\) numbers, which we call the learned representation \(\textcolor{gray}{z}\). In math language we say \(\textcolor{gray}{z\in\mathbb{R}^d}\), or representation \(\textcolor{gray}{z}\) belongs to the set of real numbers \(\textcolor{gray}{\mathbb{R}}\), with dimensionality \(\textcolor{gray}{d}\).
I know that was a lot of notation, so I hope you’re still with me! Take a minute to understand this process, with the help of the diagram below for a visual overview.
Now how do we pick a good function \(\textcolor{gray}{f}\) to represent our cat image? In the “old days” (if you’ve read ML research before 2012, I’m crying with you), expert humans would have done the Representation Learning for everyone else, i.e. used a PhD-worth of domain-specific knowledge to hand-craft good features to represent a cat. For example, maybe we care about
- Horizontal and vertical edges (Canny Edge Detector)
- Image texture (Gabor Filter)
- Something super fancy sounding (Histogram of Oriented Gradients - HoG)
There’s one slight problem, what do we do if we aren’t a domain expert with years of research experience? Enter this story’s main character: Machine Learning.
What is Machine Learning?
What if we could let a machine learn this function \(\textcolor{gray}{f}\) from the data? That way, we wouldn’t need image processing PhDs to come up with fancy specialized featurizers (like Canny, Gabor, and HoG) that, while we understand what they are doing, they don’t generally work well for new kinds of data.
Click here to know more about the History of Learning \(\textcolor{gray}{f}\) from Data
For Images, this function class \(\textcolor{gray}{f}\) was dominated for a long time by Convolutional Neural Networks(CNNs), after the CNN AlexNet kicked off the Deep Learning revolution in 2012. The introduction of the Transformer architectureNeural Encoders as they learn an encoding of the data that computers can work with using Neural Networks.
If you’d like to learn more about how popular Neural Encoders learn good functions \(\textcolor{gray}{f}\), I heartily recommend an excellent series of blogs from Jay Alammar, especially the basics of Neural Networks and the Illustrated Transformer.
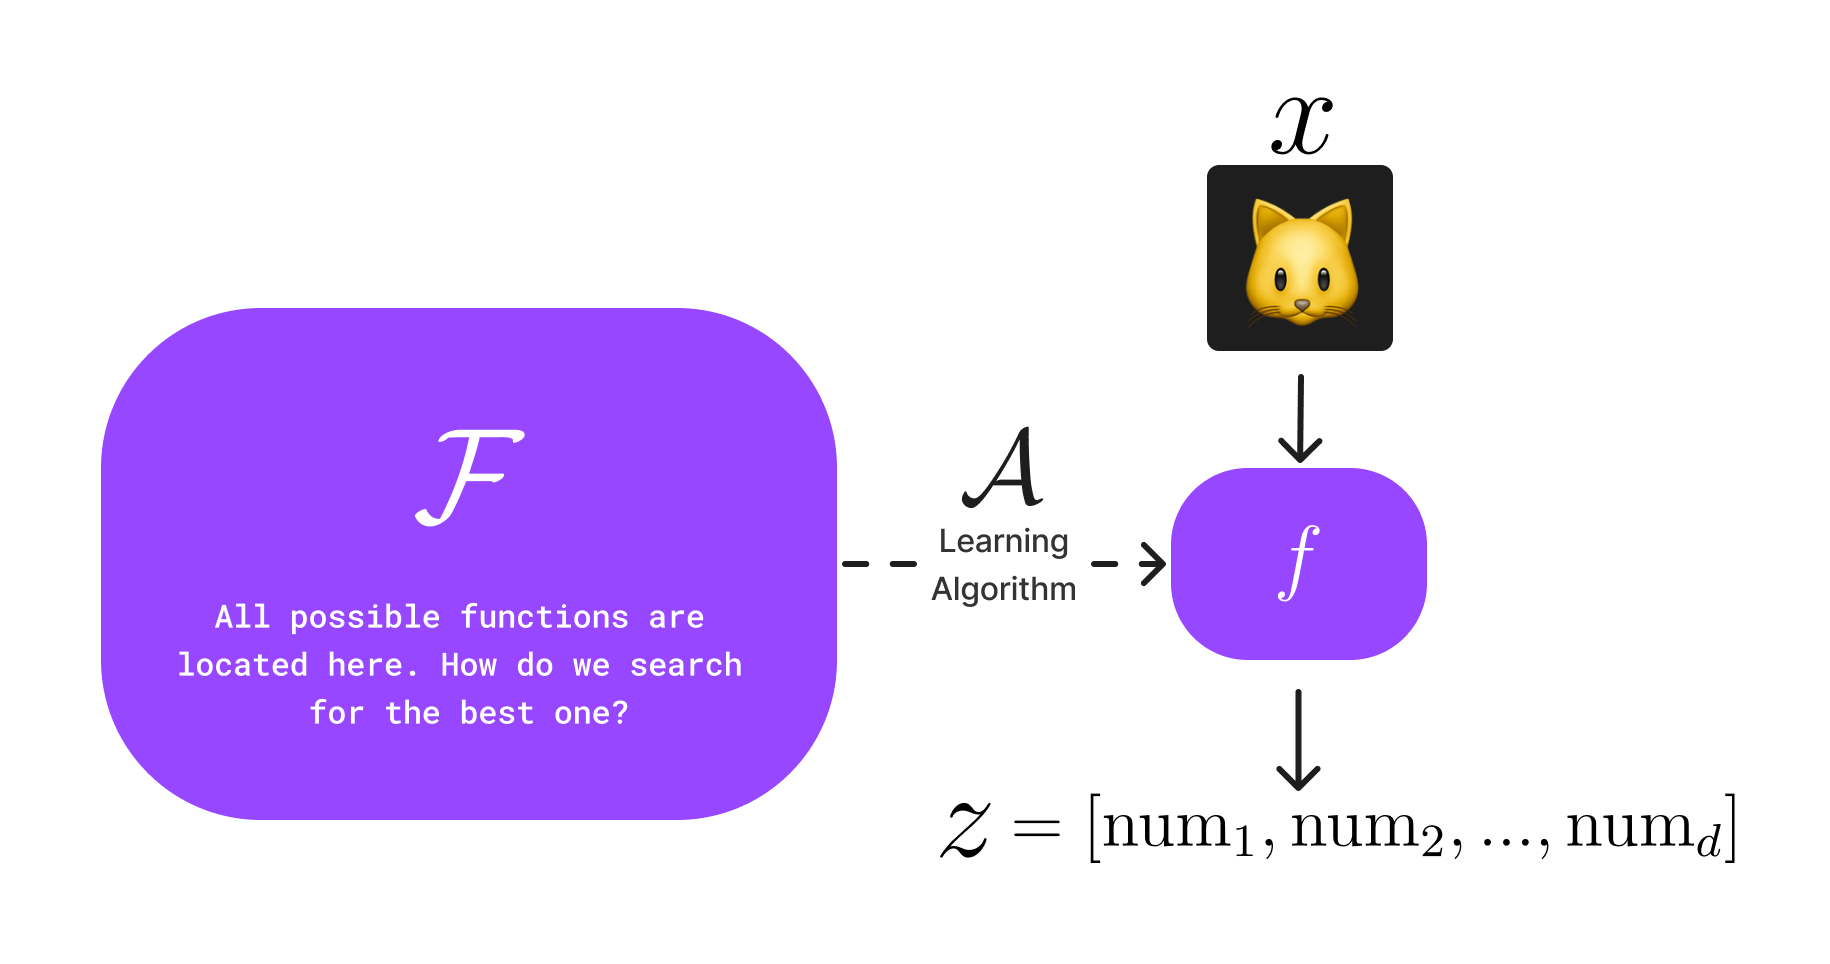
This is great, now we can offload the expertise of crafting features to a neural network that can learn an encoder function \(\textcolor{gray}{f}\). As seen in the figure above, this workflow involves a learning algorithm \(\textcolor{gray}{\mathcal{A}}\) that is able to search the space of all possible functions \(\textcolor{gray}{\mathcal{F}}\) to learn (hopefully) a good representation of the data \(\textcolor{gray}{z=f(x)}\), i.e. a sequence of \(\textcolor{gray}{d}\) numbers our computer can understand.
But what does it mean to learn a “good” representation \(\textcolor{gray}{z}\)? This question was the inspiration for Matryoshka.
Practical ML Training
tl;dr
We use proxy “objective functions” to train our models with the hope that they achieve our actual goals.
How do we Train Machine Learning Models?
We train modern Machine Learning models (since 2012, these are typically “Deep”, i.e. very large, and always getting larger!) with some human interpretable goal. For example, we may want a Face Recognition Model to correctly identify employees of a business entering the premises with 99% accuracy. How do we train a model to achieve this? In ML land, we use an objective function, or “loss” to steer our initial (bad) model to update itself iteratively and hopefully do slightly better each time until we hit the 99% accuracy we require.
Click here to know more about Optimization, the Study of how to Train Good ML Models
There exists rich literature in optimization, the study of how to train machine learning models well, which typically means with some guarantees on performance. With modern Deep Learning methods, these theoretical guarantees become trickier to achieve, and yet they seem to empirically work well with lots of good quality data and scale. The prevalent optimization methods that work well are gradient-based, which simply stated means you find the most promising “direction” for the model to update itself, and take a small step in that direction with every training iteration.
This promising direction is the negative gradient, i.e. the derivative of the loss with respect to the weights of the model. What this means is that the objective we choose has to be differentiable, or we won’t be able to figure out which direction we need to travel to get better predictions. Hopefully the ubiquity of this relatively simple calculus in nearly all modern machine learning would make Isaac Newton very happy (or Gottfried Leibniz if you swing that way).
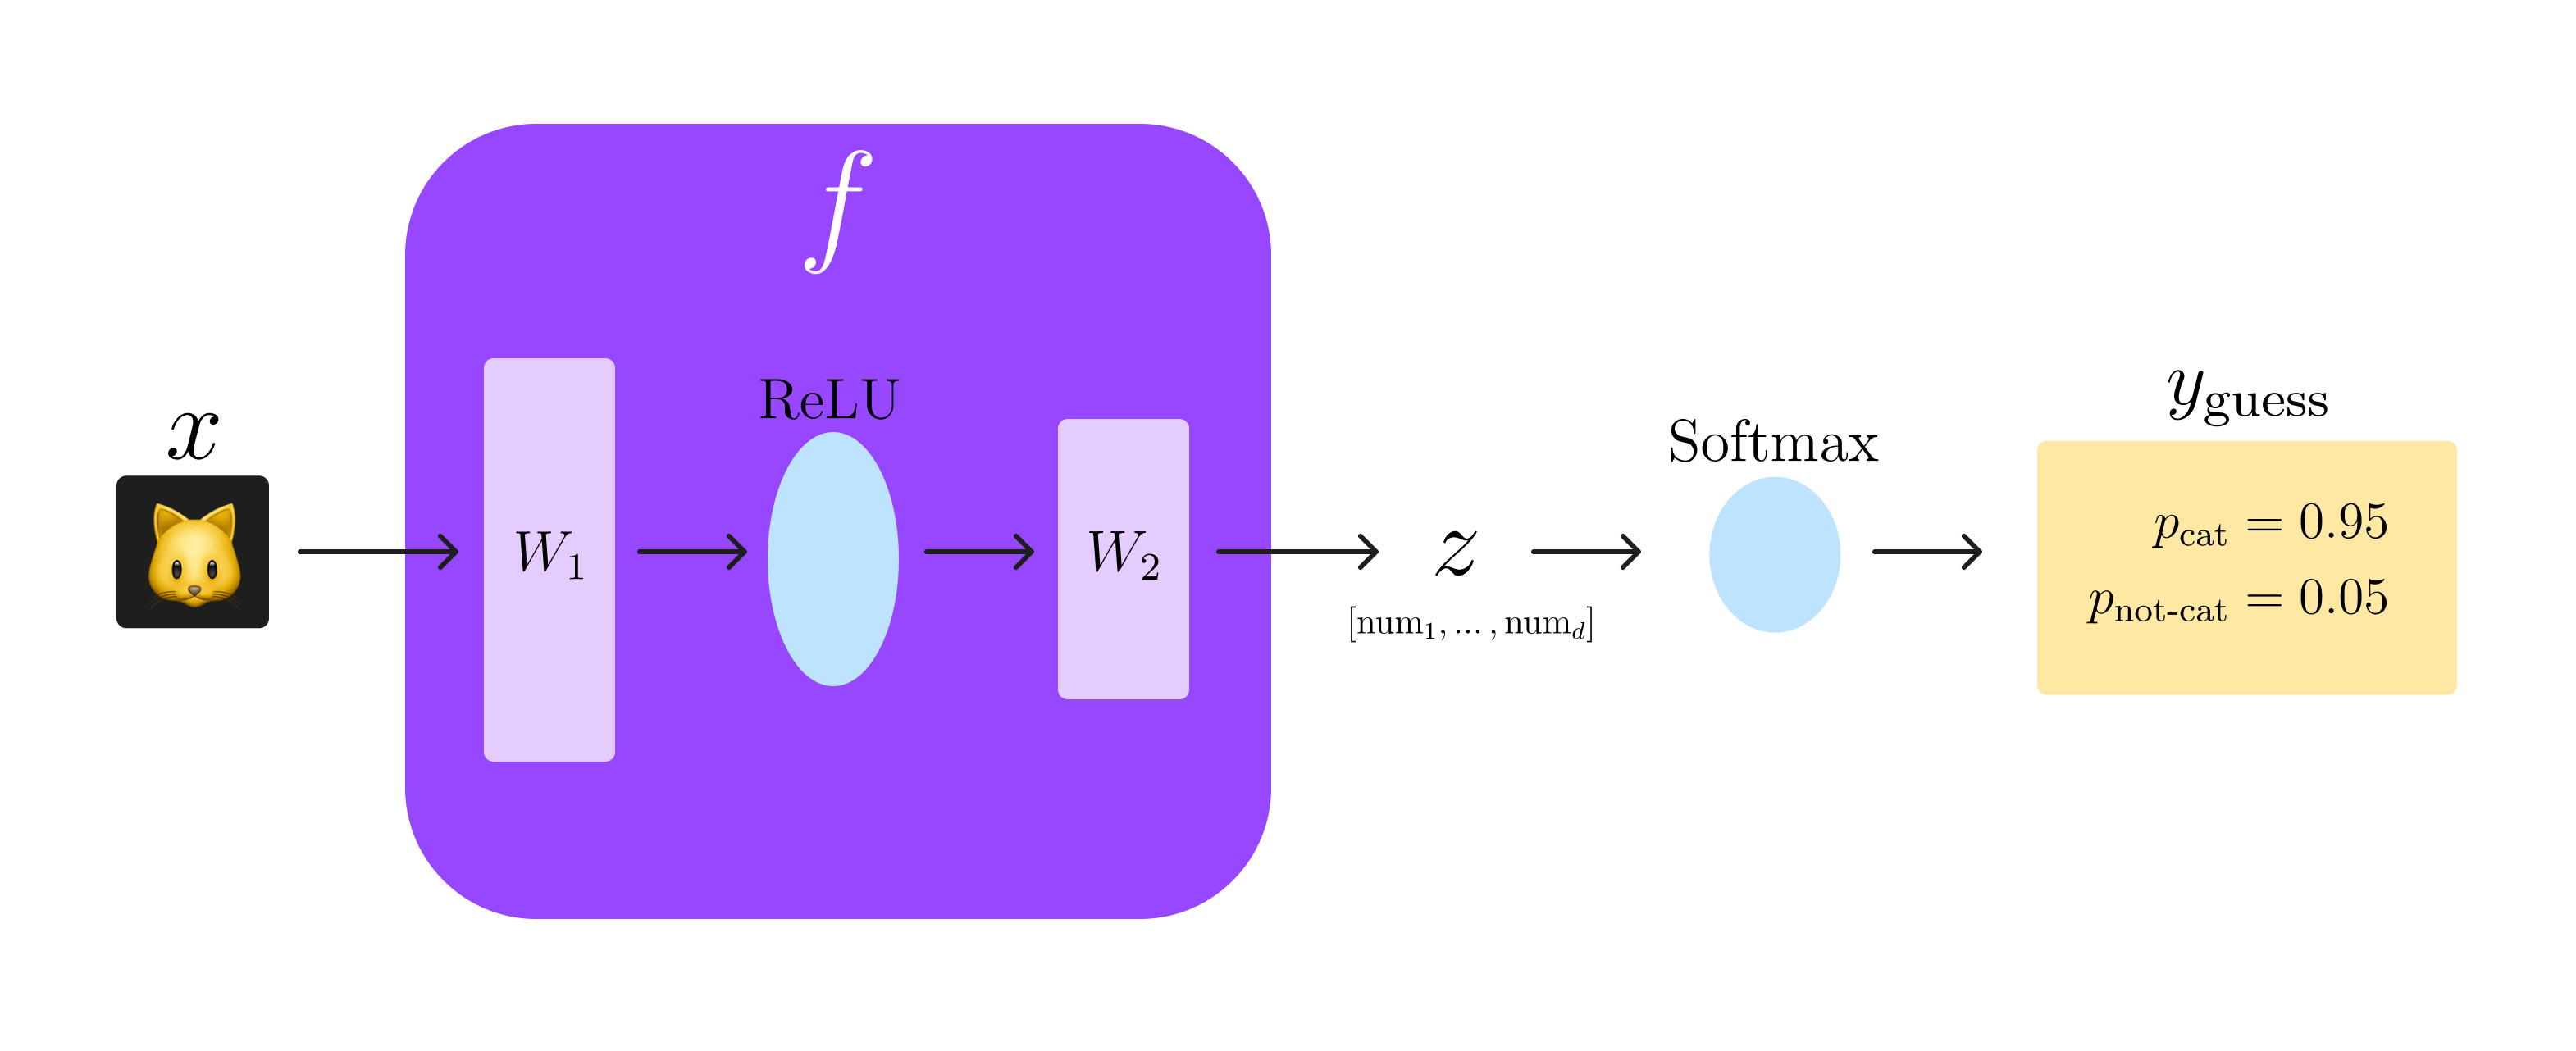
Let’s look at a very simple 2-layer neural network whose goal is to predict if an image is a cat or not. Don’t get scared by this math, I explain what these things mean below ![]()
To explain this scary notation: \(\textcolor{gray}{f}\) is our neural encoder from the Representation Learning section, which we choose to model as the simple 2-layer Neural Network above. We have two layers \(\textcolor{gray}{W_1}\) and \(\textcolor{gray}{W_2}\) with a Rectified Linear Unit (ReLU) as an activation function in the middle (don’t worry too much about this, it just gives our network a little more ‘capacity’ to learn potentially better functions \(\textcolor{gray}{f}\)). Running our input image through this network gives us our learned representation \(\textcolor{gray}{z}\), a sequence of \(\textcolor{gray}{d}\) real numbers (written in math language as \(\textcolor{gray}{z\in\mathbb{R}^d}\)). Finally, we attach a softmax function at the end, which will output two probabilities: \(\textcolor{gray}{p_\text{cat}}\) and \(\textcolor{gray}{p_\text{not-cat}}\), where \(\textcolor{gray}{p_\text{cat} + p_\text{not-cat} = 1}\). We consider whichever probability is higher to be our network’s “guess” for whether \(\textcolor{gray}{x}\) was a cat image or not, i.e. \(\textcolor{gray}{y_\text{guess}}\). This process is illustrated visually in the diagram below:
Let’s say we choose a good loss to train our model, e.g. a simple cross-entropy (not important to understand this example). If we test our trained model on 50 unseen cats and 50 unseen dogs, we would hope that \(\textcolor{gray}{y_{guess} = y_{true}}\) on at least 99 of them, to hit our 99% accuracy goal. Take a second to think of what a “bad” model would do in our cat classifier case.
What accuracy will a “bad” binary classification model give?
The worst model is one that is completely uncertain about its prediction, because it gives us no useful information about our data. For binary classification, i.e. with two classes (cat vs. not cat), complete uncertainty means our model guesses randomly between cat and not cat, i.e. \(\textcolor{gray}{\text{accuracy} = 50\%}\). What is a “bad” classifier if we had ten classes?
Your (suggested) takeaway from this Section should be:
Huh, our human goal was to classify cats correctly 99% of the time, but our machine objective was this scary sounding
cross-entropy. What gives? Why can’t we train our model with agit-gud-at-catsloss?
This is the crux of modern optimization methods: a misalignment between human goals and the methods we use to train models. In our cat case, we hope that the “cross entropy” is a good proxy for our actual human-specified goal. We will consider this misaligned setting for the rest of this article, but I do provide some optional further reading below on very popular recent efforts towards directly optimizing for human preferences, which is the focus of my current research.
Click here to read about Modern Efforts to Directly Optimize Human Preferences
There has been a lot of recent effort towards directly aligning large Machine Learning models to human goals, especially in the realm of Large Language Models, with Reinforcement Learning (RL). This excellent blog post from Lambert et. al
Matryoshka
Alright, so you now hopefully have a basic understanding of
- How we use modern Deep Learning methods to learn good representations of data (Representation Learning)
- Why we train Neural Encoders with proxy loss functions: the faith that we will achieve our human-interpretable goals, without directly optimizing for them (Practical ML Training)
I’ll now talk about a slightly different problem in modern Machine Learning:
How can we learn the generally “best” representation for some given data, and does one even exist?
Click here to Think more about this Question
But first, another question: instead of training our simple cat classifier example above, can we just use a large “foundation” model that someone has already trained that has a good understanding of animals, and somehow transfer that knowledge to directly guess whether an image is a cat? (Some examples include Google’s ViT, Meta’s DINO, OpenAI’s CLIP and Microsoft’s LLaVa). This process is called transfer learning, and is a huge part of what makes modern Deep Learning accessible to researchers and smaller companies with limited resources: we can’t all afford to spend millions of dollars training our models!
So how DO we know how “good” a representation is? Do we just have faith in our corporate overlords? Maybe let’s use that as a backup option. Let’s instead define a notion of “goodness” which is directly tied to tasks we care about; after all, we want our representations to be practically useful. For example, the Visual Task Adaptation Benchmark (VTAB) is a suite of 19 tasks designed to test how generally “good” a visual representation is on things it has not been trained on, which is sometimes called generalizability or robustness of representations. This is a great starting point, i.e. exhaustive benchmarking and evaluation! Is this our holy grail, the "best" representation?
Spoiler: it’s not quite that simple, because we can’t exhaustively benchmark our representation in all tasks and scenarios!
What Led to Creating MRL?
ML Researcher Bonus: Inklings of Nested Codebook Subspaces
Hold on a second, nested subspaces? Codebooks? What does this all mean? Let’s first look at what MRL is under the hood, and circle back here once we’ve understood how MRL works.
Have you circled back? Yay! Think of MRL as extending LLC from learning \(\textcolor{gray}{k}\)-bit binary codes to \(\textcolor{gray}{d}\)-dimensional embeddings. See the understanding why MRL works section for a walkthrough of what
nested subspacesare, with the help of Calvin and Hobbes!
The motivation for MRL was sparked from work in 2021 by Kusupati et. al on learning low-dimensional codebooks (LLC)nested codebooks with \(\textcolor{gray}{k \in(20, 25, 30)~\text{bits}}\) instead of training three independent codebooks. We could then, for example, easily just use a \(\textcolor{gray}{k=23}\) bit codebook for our data, even though we did not train to learn representations at this value of \(\textcolor{gray}{k}\).
To restate this more simply, we were
too lazy to train multiple modelswith different \(\textcolor{gray}{k}\), so we decided to train just one that worked at all \(\textcolor{gray}{k}\).
🤯I still cannot believe that a runaway para (pg 9) in our old paper (LLC, NeurIPS'21) lead to all the Matryoshka works🪆
— Aditya Kusupati (@adityakusupati) February 14, 2024
At that time, I did it as I didn't have compute to train 3 models 🤣
Last couple of weeks have been surreal, thanks everyone!
LLC: https://t.co/gRL6xCOhhP pic.twitter.com/6eSr3w38jQ
Codebooks to Embeddings
Recall that we said above that the representation or embedding \(\textcolor{gray}{z}\) learned by our Neural Encoder \(\textcolor{gray}{f}\) for our input data \(\textcolor{gray}{x}\) is a sequence of \(\textcolor{gray}{d}\) numbers, i.e. \(\textcolor{gray}{z = f(x) \in \mathbb{R}^d}\). I now ask you the question that led to Matryoshka Representation Learning:
What is the best choice of representation dimensionality \(\textcolor{gray}{d}\) to learn a “good” representation? And is this the same value for all kinds of data? If your answer to this question was
Hmm probably notthen your thought process is exactly where we (the MRL authors) were in Late 2021.
Let’s illustrate this idea concretely with an example from the MRL paper
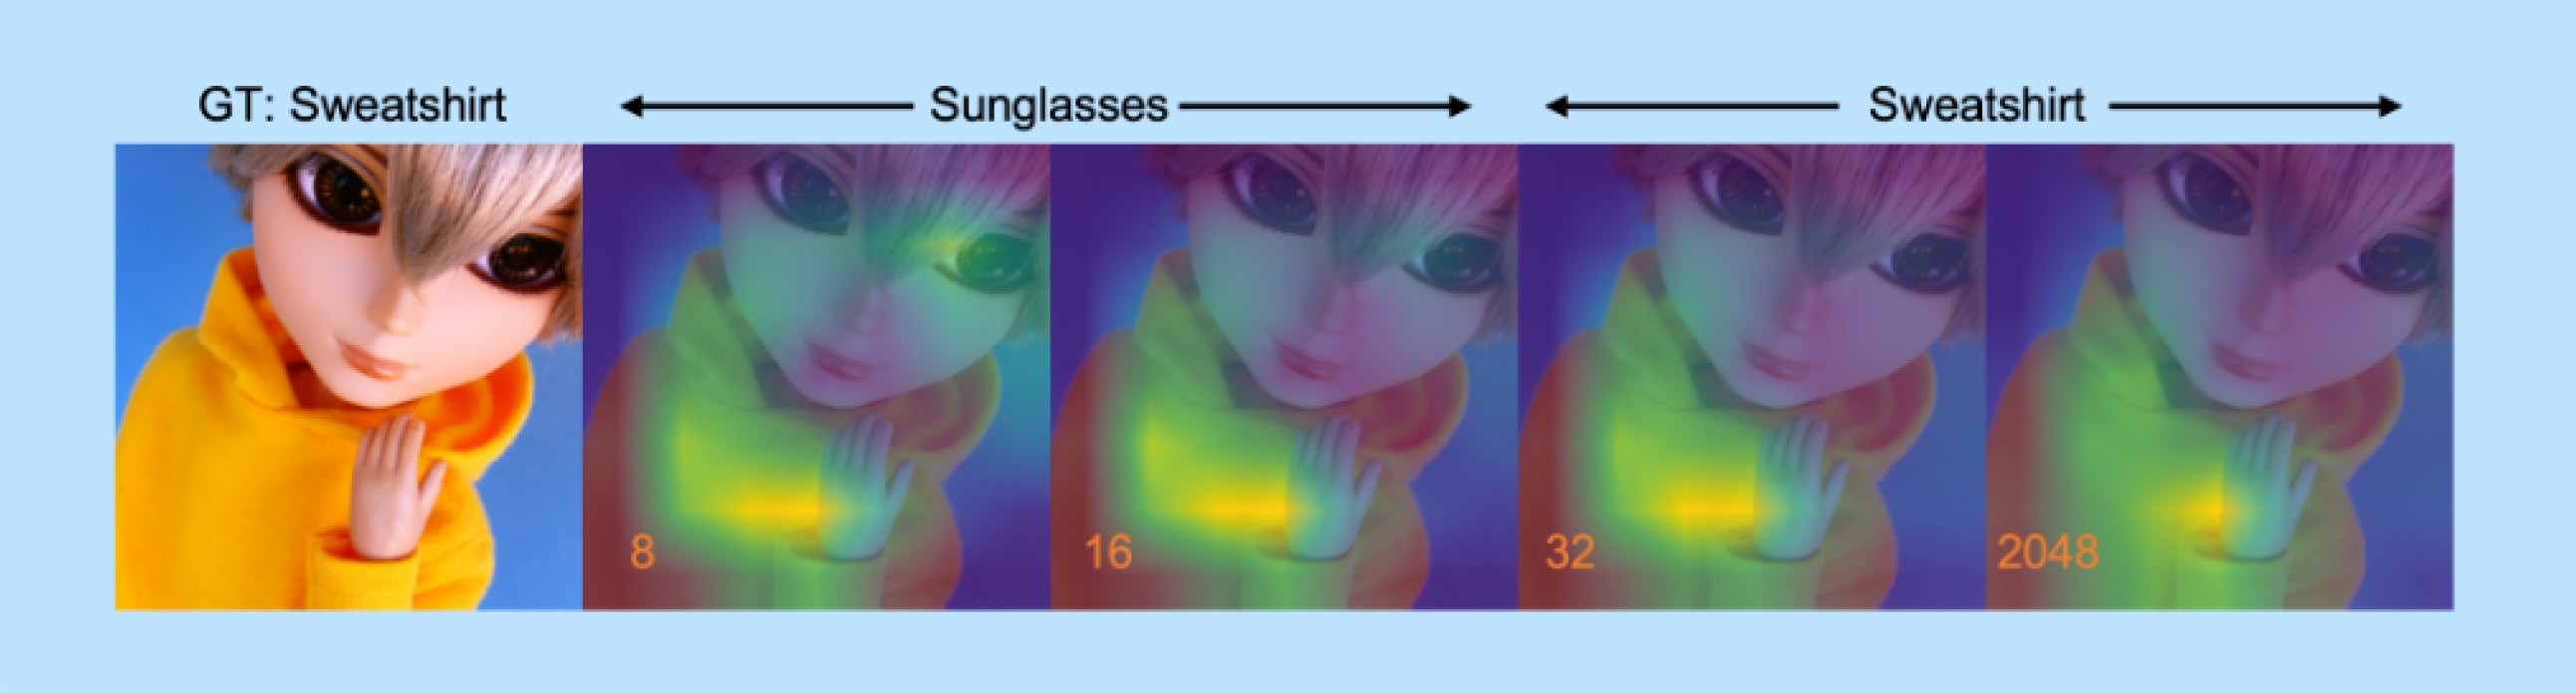
As we can see, with very small dimensionality \(\textcolor{orange}{d}\), the model makes a mistake and thinks the image is Sunglasses, which we can see with \(\textcolor{green}{\text{where the model is looking}}\). When we increase \(\textcolor{orange}{d=32}\), the model is able to shift its focus more to Sweatshirt and get the prediction correct, and it stays correct until \(\textcolor{orange}{d=2048}\). This means we could have easily just used a \(\textcolor{gray}{\dfrac{2048}{32} = 64\times}\) smaller embedding to correctly predict this image!
It makes sense to use the smallest \(\textcolor{gray}{d}\) that works for every data point, because we can save memory (less numbers = less memory) and run faster inference, i.e. compute \(\textcolor{gray}{y_\text{guess}}\) as shown in the ML Training section.
There’s one problem: machine learning models are trained with fixed representation dimensionality \(\textcolor{gray}{d}\). For ResNet-50text-embedding-3-large, \(\textcolor{gray}{d=3072}\). If we want a smaller \(\textcolor{gray}{d}\), the prevalent methods were to use traditional dimensionality reduction techniques, such as Principal Component Analysis. The problem with these methods is that they operate “post-hoc” after our \(\textcolor{gray}{d}\)-dimensional embedding as been learned by our Neural Encoder, and are thus not data-aware or learned. Is there a way to automatically learn these lower dimensional embeddings without training separate models every time?
tl;dr
Can we encourage our own laziness (or lack of GPUs
) to train many independent models and
just train one model instead?
What is MRL? (Really this Time)
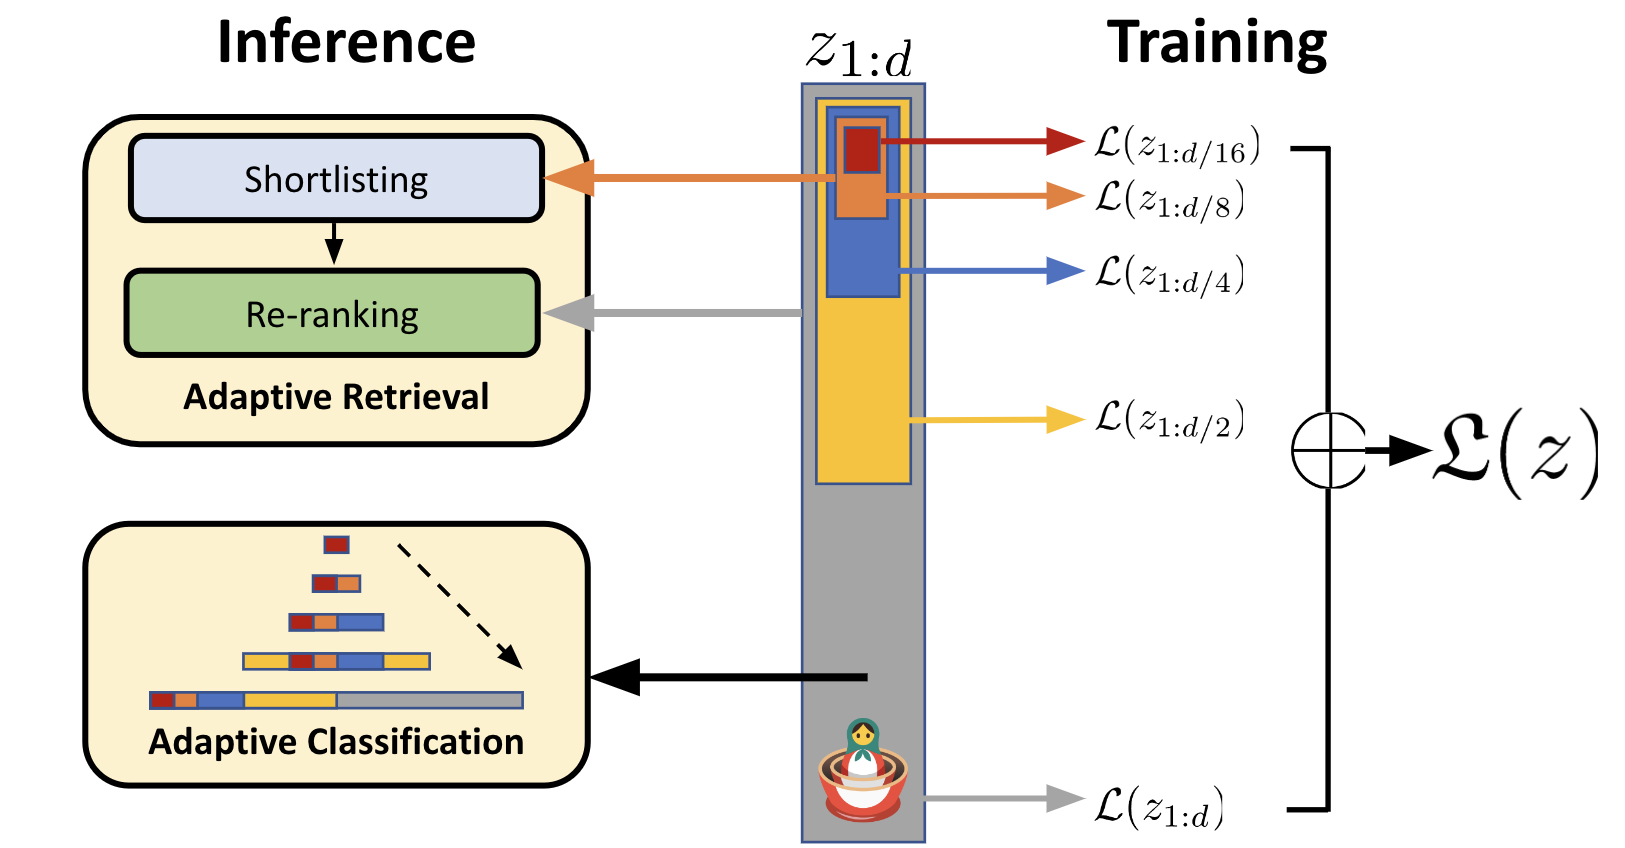
MRL learns these lower-dimensional embeddings baked into the original embedding, just like a series of Matryoshka Dolls! For example, the \(\textcolor{red}{\text{smallest doll}~z_{1:8}}\) has representation dimensionality \(\textcolor{red}{d=8}\), which sits inside a \(\textcolor{orange}{\text{slightly larger doll}~z_{1:16}}\) with \(\textcolor{orange}{d=16}\), which sits inside an \(\textcolor{blue}{\text{even larger doll}~z_{1:32}}\), until we reach the \(\textcolor{Gray}{\text{\textbf{largest doll}}~z_{1:2048}}\) with \(\textcolor{gray}{d=2048}\), as seen in the figure below. Hereon, I will interchangeably use dolls to refer to representations learned by MRL.
What are those symbols under “Training”?
MRL is primarily a training paradigm to learn a nested structure of representations, resembling Matryoshka dolls. So how do we train a model to enforce this structure? It’s actually surprisingly simple! We apply the same cross-entropy loss we would have used for a plain old regular model (just the \(\textcolor{Gray}{\text{\textbf{largest doll}}~z_{1:2048}}\)) to each doll independently, and average all these losses together:
This simple modification forces the model to learn dolls that are valid and useful representations of the data by themselves (otherwise that specific doll’s loss would be high!) This means we can freely use whichever doll fits our purpose (budget vs accuracy).
How Good is MRL?
You may be wondering, how does learning Matryoshka dolls compare to training a new doll from scratch at different dimensionality \(\textcolor{gray}{d}\) every time? While training all dolls at once with MRL is much more efficient, surely each MRL doll’s performance will be worse than than its corresponding independently trained doll?
We were pleasantly surprised to discover that \(\textcolor{blue}{\text{MRL dolls}}\) outperform \(\textcolor{green}{\text{independently trained dolls}}\) at each dimensionality, as seen in the figures below from the MRL paper
(a) Million scale on ImageNet-1K with a ResNet-50
(b) Billion scale on JFT-300M
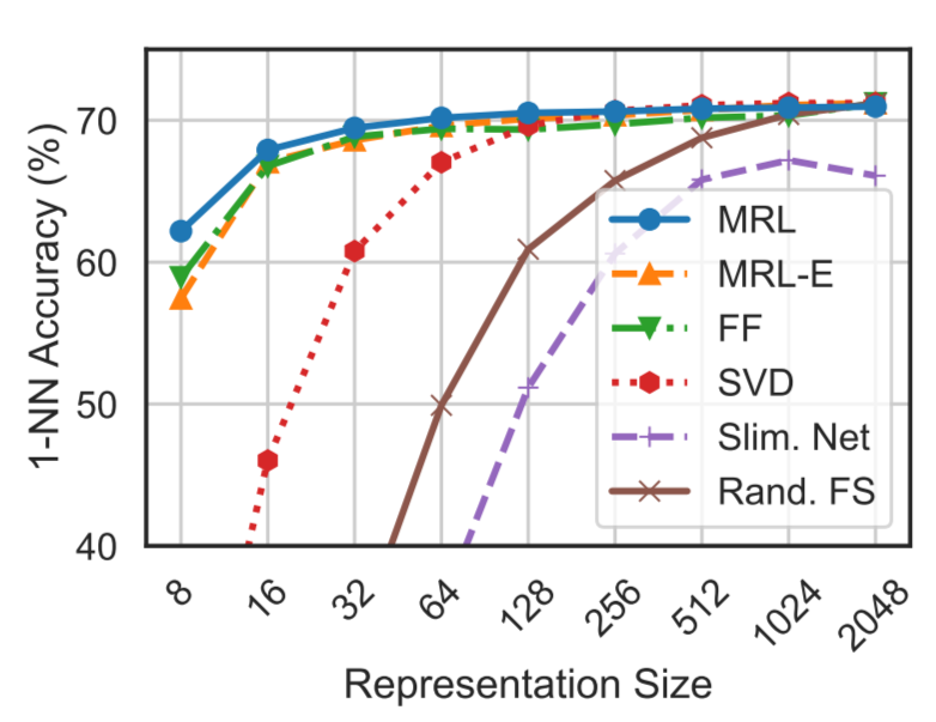
a) ResNet-50 1-NN Accuracy on ImageNet
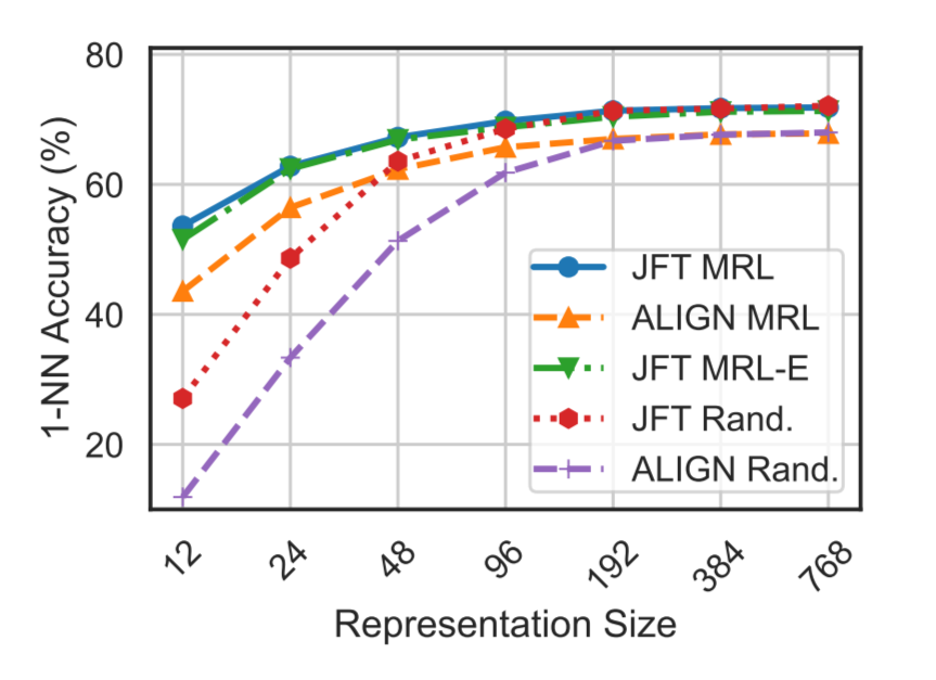
b) ViT B/16 and ALIGN 1-NN Accuracy on JFT
In summary, MRL provides little to no accuracy drop for large efficiency gains across:
-
Data Scale- million to billion -
Data Modality- vision, language, vision + language -
Neural Encoder Architecture- ResNet-50, ConvNeXt, ViT, BERT, ALIGN
Why Does MRL Work?
I’m going to be frank with you: we still don't know for sure, but we have a good hypothesis: MRL learns a coarse-to-fine hierarchy of nested subspaces, and efficiently packs information in all vector spaces while being explicitly trained only at logarithmic granularities (\(\textcolor{gray}{d_{ImageNet}}\) and \(\textcolor{gray}{d_{JFT}}\)). As long as we learn a dense vector representation \(\textcolor{gray}{z}\), MRL just works! Let’s motivate this intuition with some experiments, shall we?
The Marginal Utility of Increasing Information
Recall that MRL was born from the question:
How much information do we need to represent our data well, i.e. how big does \(\textcolor{gray}{d}\) need to be?
We hypothesize that MRL’s nested loss \(\textcolor{gray}{\mathcal{L_\text{Matryoshka}}}\) (see “symbols under training” here) enforces a vector subspace structure - each learned representation vector \(\textcolor{gray}{z\in\mathbb{R}^d}\) lies in a \(\textcolor{gray}{d}\)-dimensional vector space that is a subspace of larger vector space. Woah hold on, that made no sense to me. Why are you throwing math-y jargon at me? Let’s simplify this with an example:
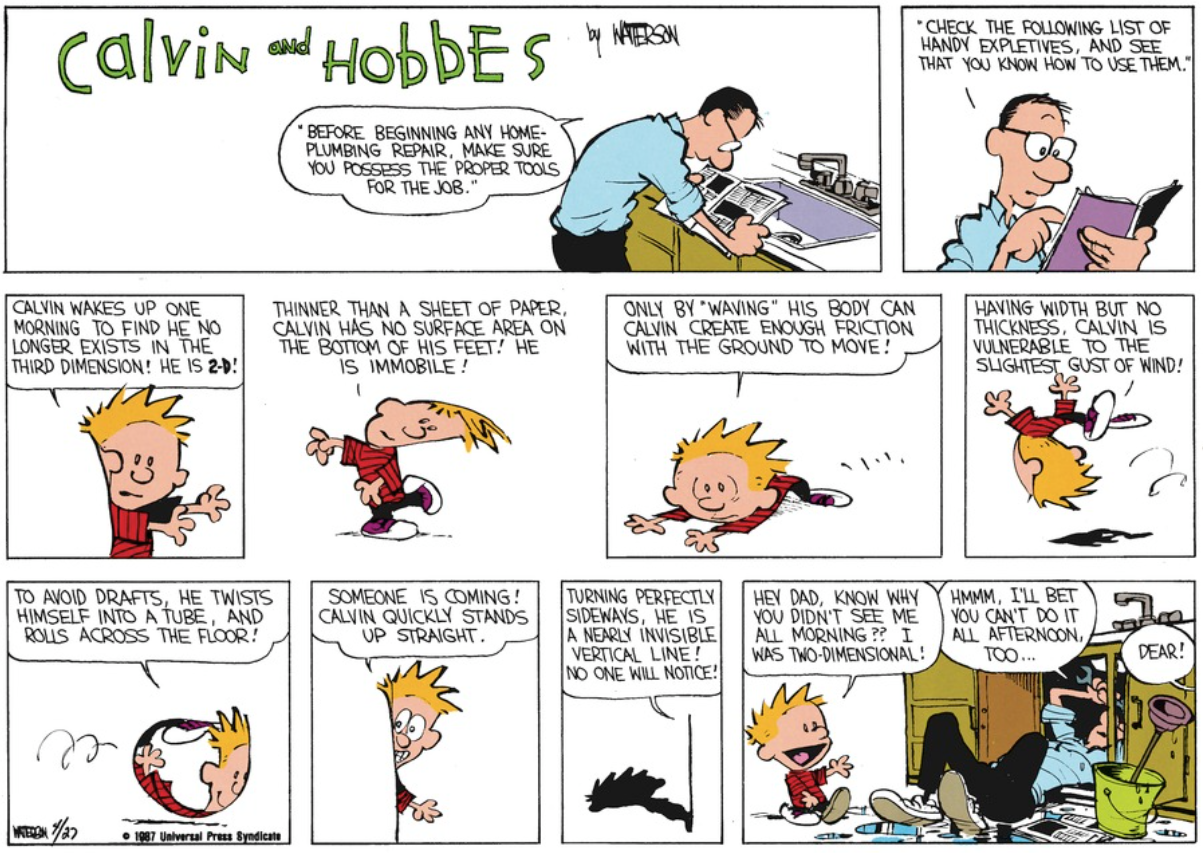
I’m going to use an analogy from my favorite comic book series (sorry xkcd, you’re close behind). Think of the characters of Calvin and Hobbes as vectors lying in 3D space (i.e. the vector space \(\textcolor{gray}{\mathbb{R}^3}\)), just like you and I are in the real 3D world (quick caveat: Bill Watterson has projected the world of Calvin & Hobbes to 2D space to draw them in comic books, because we unfortunately don’t have 3D comic books quite yet! Or wait, are animated movies 3D comics? ![]() )
)
In the comic strip above, Calvin suddenly wakes up to find himself existing only in the 2D vector space \(\textcolor{gray}{\mathbb{R}^2}\), while the rest of his world is still in 3D! We can see how difficult this kind of existence would be in the rest of the strip. Calvin has woken up in the 2D subspace of 3D vector subspace, as he exists in both 2D and 3D! Come to think of it, all 2D objects (like Calvin) also exist in 3D space, don’t they? This is exactly the concept of the vector subspace structure that we hypothesize MRL is enforcing: vectors embedded with MRL lie in nested subspaces - e.g. for ImageNet, vectors lie in subspaces from \(\textcolor{gray}{\mathbb{R}^8}\) to \(\textcolor{gray}{\mathbb{R}^{2048}}\).
Now how can we examine if this hypothesis has any validity? Unfortunately, we can’t visualize vector spaces in 4D or higher (if you can, please let me know). What can we do?
Low-dimensional Visualizations of MRL Vector Spaces
Luckily for us dimensionality reduction techniques like PCA and t-SNE are the answer! Generally speaking, these techniques try to preserve relationships between vectors in high-d vector spaces (e.g. \(\textcolor{gray}{\mathbb{R}^{3072}}\)) in low-d subspaces that we can actually visualize (i.e. \(\textcolor{gray}{\mathbb{R}^{2}}\) or \(\textcolor{gray}{\mathbb{R}^{3}}\))
1. PCA
Zain Hasan created a simple and clean visualization of MRL vectors encoded into both 2D and 3D subspaces with PCA as we increase dimensionality of the high-d vector space, which you can see below. As seen in the visualization, the structure of data is quite consistent after \(\textcolor{gray}{\mathbb{R}^{512}}\) and barely changes after \(\textcolor{gray}{\mathbb{R}^{2000}}\). This means that we can capture a significant portion of the structure of vectors in \(\textcolor{gray}{\mathbb{R}^{512}}\), whose vectors are only 16% as large as the vectors from the largest vector space \(\textcolor{gray}{\mathbb{R}^{3072}}\)!
More visualizations helping me understand my own paper 🤪 amazing work @ZainHasan6 !
— Aniket Rege (@wregss) February 14, 2024
When creating MRL, we thought about the marginal utility of increasing dims (e.g. what really changes if we jump from 64-d to 128-d? How much additional information do we get?)
(1/n) https://t.co/SEQeHiLWol
This visualization agrees with the accuracy saturation we observed on ImageNet and JFT (see How Good is MRL), which were aggregate (average) numbers. This visualization indicates that there is actually a geometric subspace structure that backs up the diminishing returns of accuracy as we increase embedding dimensionality.
2. t-SNE
The folks at Nomic AI shared this excellent interactive visualization (go play with it!) of MRL embeddings on their own Nomic dataset with a t-SNE:
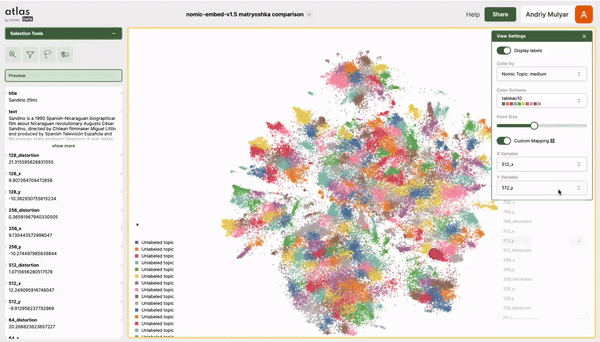
As you can see, the structure of the data is fairly consistent from a low-d subspace \(\textcolor{gray}{\mathbb{R}^{128}}\) to the largest vector space \(\textcolor{gray}{\mathbb{R}^{768}}\), differing only by a rotation. While t-SNE clustering should be taken with a grain of salt (data clustered in t-SNE visualizations may not necessarily be clustered in high-d), this visualization provides evidence about the similarity in subspace structure as we reduce the subspace dimensionality \(\textcolor{gray}{d: 768\to 128}\), i.e. we can capture a good amount of the structure of data with \(\textcolor{gray}{d=128}\), we don’t need the largest vector space with \(\textcolor{gray}{d=768}\)!
In summary, the marginal utility of jumping to a higher-dimensional vector space quickly saturates, and MRL helps you find the sweet spot!
Using MRL
Web-Scale Search!
Now what can we do with this collection of dolls? You might have gotten a hint from the diagram above, but if not, Matryoshka enables a strong information retrieval setup, just like how Google shows you your favorite cat pics when you search for them! Here’s a walkthrough of what that might look like:
Encode your Data
Use the largest doll that fits in your budget to encode all cat pictures on the internet into a database \(\textcolor{gray}{X_{Mat}}\). For example, say you have 50 Million cat images (please share them with me) and 100 Gigabytes of storage. With fp32 precision
- The smallest doll \(\textcolor{gray}{d=8}\) would occupy \(\textcolor{gray}{8 * 4 = 32}\) bytes of memory, and thus \(\textcolor{gray}{X_{Mat}}\) would occupy \(\textcolor{gray}{50,000,000 * 32 = 400}\) Megabytes on disk. We are only using 0.4% of our 100GB budget, we can go much higher!
- The largest doll \(\textcolor{gray}{d=2048}\) would occupy \(\textcolor{gray}{2048 * 4 = 8192}\) bytes of memory, and thus \(\textcolor{gray}{X_{Mat}}\) would occupy \(\textcolor{gray}{50,000,000 * 8192 = 409.6}\) Gigabytes on disk. The largest doll is too big to fit into our 100 GB memory budget, we need something in the middle!
- With some quick mafs calculations, we see that we can use a doll of size \(\textcolor{gray}{d=500}\), since \(\textcolor{gray}{X_{Mat}}\) would occupy \(\textcolor{gray}{50,000,000 * 500 * 4 = 100}\) Gigabytes exactly.
Build a Search Index
Now that we have encoded our data with MRL, we need a way to search for relevant cat pictures, using a search index built on top of our database \(\textcolor{gray}{X_{Mat}}\)! To speak more corporately, Meta uses hierarchical graph indices
Searching a Query
Let’s say we want to find the best “Derpy Orange Cat” in our database. We’ll use the search index to find the 50 closest matches (in ML terminology, “Nearest Neighbors”), and hopefully serve a very happy customer! MRL has enabled us to use a high-dimensional embedding "for free", since we didn’t have to train or finetune a separate 500-dimensional doll to encode our database, or use dimensionality reduction methods on our largest doll.
Hold on a Minute, Can we Just Use any Doll?
You may have already asked the question: Hey, we only trained MRL at specific doll sizes \(\textcolor{gray}{d_{ImageNet}}\) and \(\textcolor{gray}{d_{JFT}}\). Can we just use any doll of size \(\textcolor{gray}{d}\) that doesn’t lie in these specific values we used to train the MRL model?
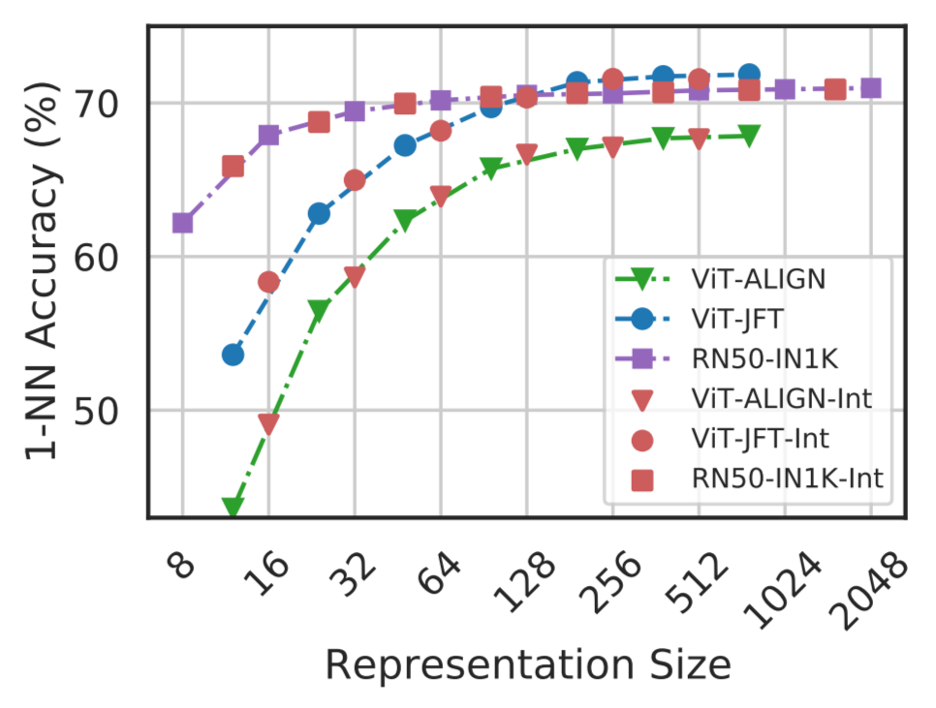
MRL model accuracies interpolate!
It turns that yes, you can - MRL model accuracies seamlessly interpolate at all doll sizes between the fixed doll sizes it was trained for (\(\textcolor{gray}{d_{ImageNet}}\) and \(\textcolor{gray}{d_{JFT}}\))! You can see this in the figure from the MRL paper above, where the X-Axis is the doll size or representation size, and all the \(\textcolor{red}{\text{red points}}\) are evaluations at \(\textcolor{red}{\text{interpolated sizes}}\). This means we can freely, in the words of OpenAI, “remove some numbers from the end of the sequence” of any representation, and use that embedding directly! I’m not going to make a doll analogy for this because the thought is quite gruesome.
Adaptive Retrieval
A very simple yet powerful use-case that extends the simple web-scale search example above is to use MRL for retrieval adaptively, i.e.
- Shortlist a large pool of 1000 cat candidates with small \(\textcolor{gray}{d=32}\)
- Reorder/Rerank the shortlisted pool of cats with large \(\textcolor{gray}{d=512}\)
The reason this is easy with MRL is that the embedding for shortlisting is just a chopped-off version of the embedding for re-ordering! We thus don’t need to store multiple large copies of \(\textcolor{gray}{X_{Mat}}\) or query multiple search indices built on different \(\textcolor{gray}{d}\) (very slow).
If this sounds interesting, we showed a very simple and powerful Adaptive Retrieval technique called Funnel in the original paper, and wrote a whole new paper on Adaptive Representations for Approximate Nearest Neighbor Search (AdANNSevery component of web-scale search- stay tuned for more my next blog post about this!
There have been several excellent resources emerging on twitter walking through MRL-powered adaptive retrieval, including:
- This excellent blog post from Ujjwal Maheshwari walks through the methodology and code of MRL-style Adaptive Retrieval.
-
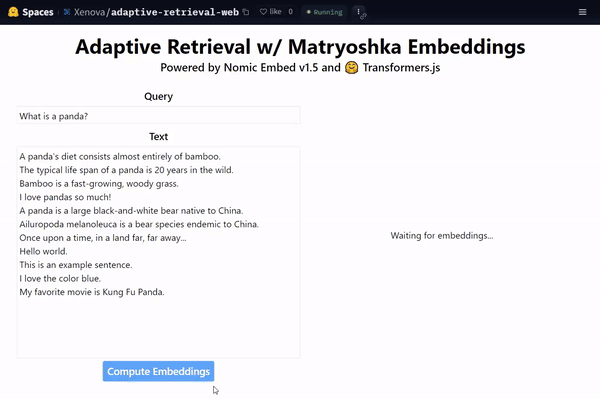
A cool demo from Xenova showing that the highest dimensionality (e.g. \(\textcolor{gray}{d=768}\) for BERT-Base) is not required to embed data - have a look at what happens in the gif above if you drop from \(\textcolor{gray}{d=768}\) all the way down to \(\textcolor{gray}{d=64}\) with MRL
-
Greg Richardson, Egor Romanov and Paul Cooplestone of Supabase wrote a comprehensive blog on Adaptive Retrieval with the new OpenAI embedding models, with some interesting insights into approximate search with HNSW
as well - this is a sneak peak into our follow-up work to MRL - AdANNS .
So What is the Catch?
None! Please go train MRL models on huge datasets with huge transformers and open source your work!
And that, dear reader, is the biggest catch: MRL models have a one-time cost of retraining from scratch to match independently trained models. We discovered that this can be alleviated to a large extent by unfreezing some of the last layers of the Neural Encoder and finetuning for several epochs (See Table 26 in the MRL paper
Open-Source MRL Models
Here are some freely available open-source MRL models to play around with!
- ResNet-18/34/50/101 MRL and independent baseline models trained on ImageNet-1K: huggingface.co/aniketr/mrl-resnet50
- ConvNeXt-Tiny trained on ImageNet-1K: huggingface.co/aniketr/mrl-convnext-tiny
- BERT-Base models finetuned on Natural Questions: huggingface.co/aniketr/mrl-nq
- Nomic AI’s long-context BERT model by: huggingface.co/nomic-ai/nomic-embed-text-v1.5
Thoughts? Get in Touch!
I know this was quite a long article, so thanks for sticking around, and I hope you got something useful out of it!
If you’re an ML or CS researcher and have thoughts or questions about our work or improving this article, I would love to have chat about MRL, our followup work, and my current research.
If you’re someone who is generally interested in our work and found this article interesting, difficult, or relevant, I’d love to hear from you too!
Please get in touch with me via aniketr@cs.wisc.edu or join the discussion on my Twitter:
With all the recent hype around 🪆Matryoshka Representation Learning 🪆(Thanks @OpenAI !), I finally put my longstanding plan of writing a detailed blog about MRL to actionhttps://t.co/guGZRSxxDo
— Aniket Rege (@wregss) February 7, 2024
This blog is NOT a paper walkthrough (see @RitvikRastogi19 for that!)
(1/7)
Further Reading
- LLC: Accurate, Multi-purpose Learnt Low-dimensional Binary Codes - learning low-dimensional binary codes for classes and instances for data, e.g. class = “Dog” and instance = a specific German Shepherd Image.
- AdANNS: A Framework for Adaptive Semantic Search - using adaptive representations (via MRL) to flexibly decouple all stages of a large scale search system and provide strong accuracy-compute tradeoff for all deployment budgets. Currently in use in Google Products.
- MatFormer: Nested Transformer for Elastic Inference - using MRL in the weight space of a Transformer to extract hundreds of smaller transformers after a single training pass.
- Pinecone blogs on Vector Search Components - a series of excellent blog posts by James Briggs on the various components of vector search at scale, including search space pruning and vector quantization techniques.
- Excellent blog posts from Nomic AI on their high quality open-source MRL embedding model, Andreas Eriksen at Vespa AI on easily using OpenAI’s MRL embeddings with Vespa.
Acknowledgements
Thanks to Harshali Paralikar, Gantavya Bhatt, and Aditya Kusupati for their feedback in editing and improving this article.